
<- Go Back
Submit & Indexing
Indexing Analytics: Performance Dashboard
The Performance Dashboard lets you view real Google Search Console data without ever leaving Framer. See clicks, impressions, CTR, average position, and your top keywords, all pulled live from your verified property.
Last Updated on
Read Time
4 min read
Overview
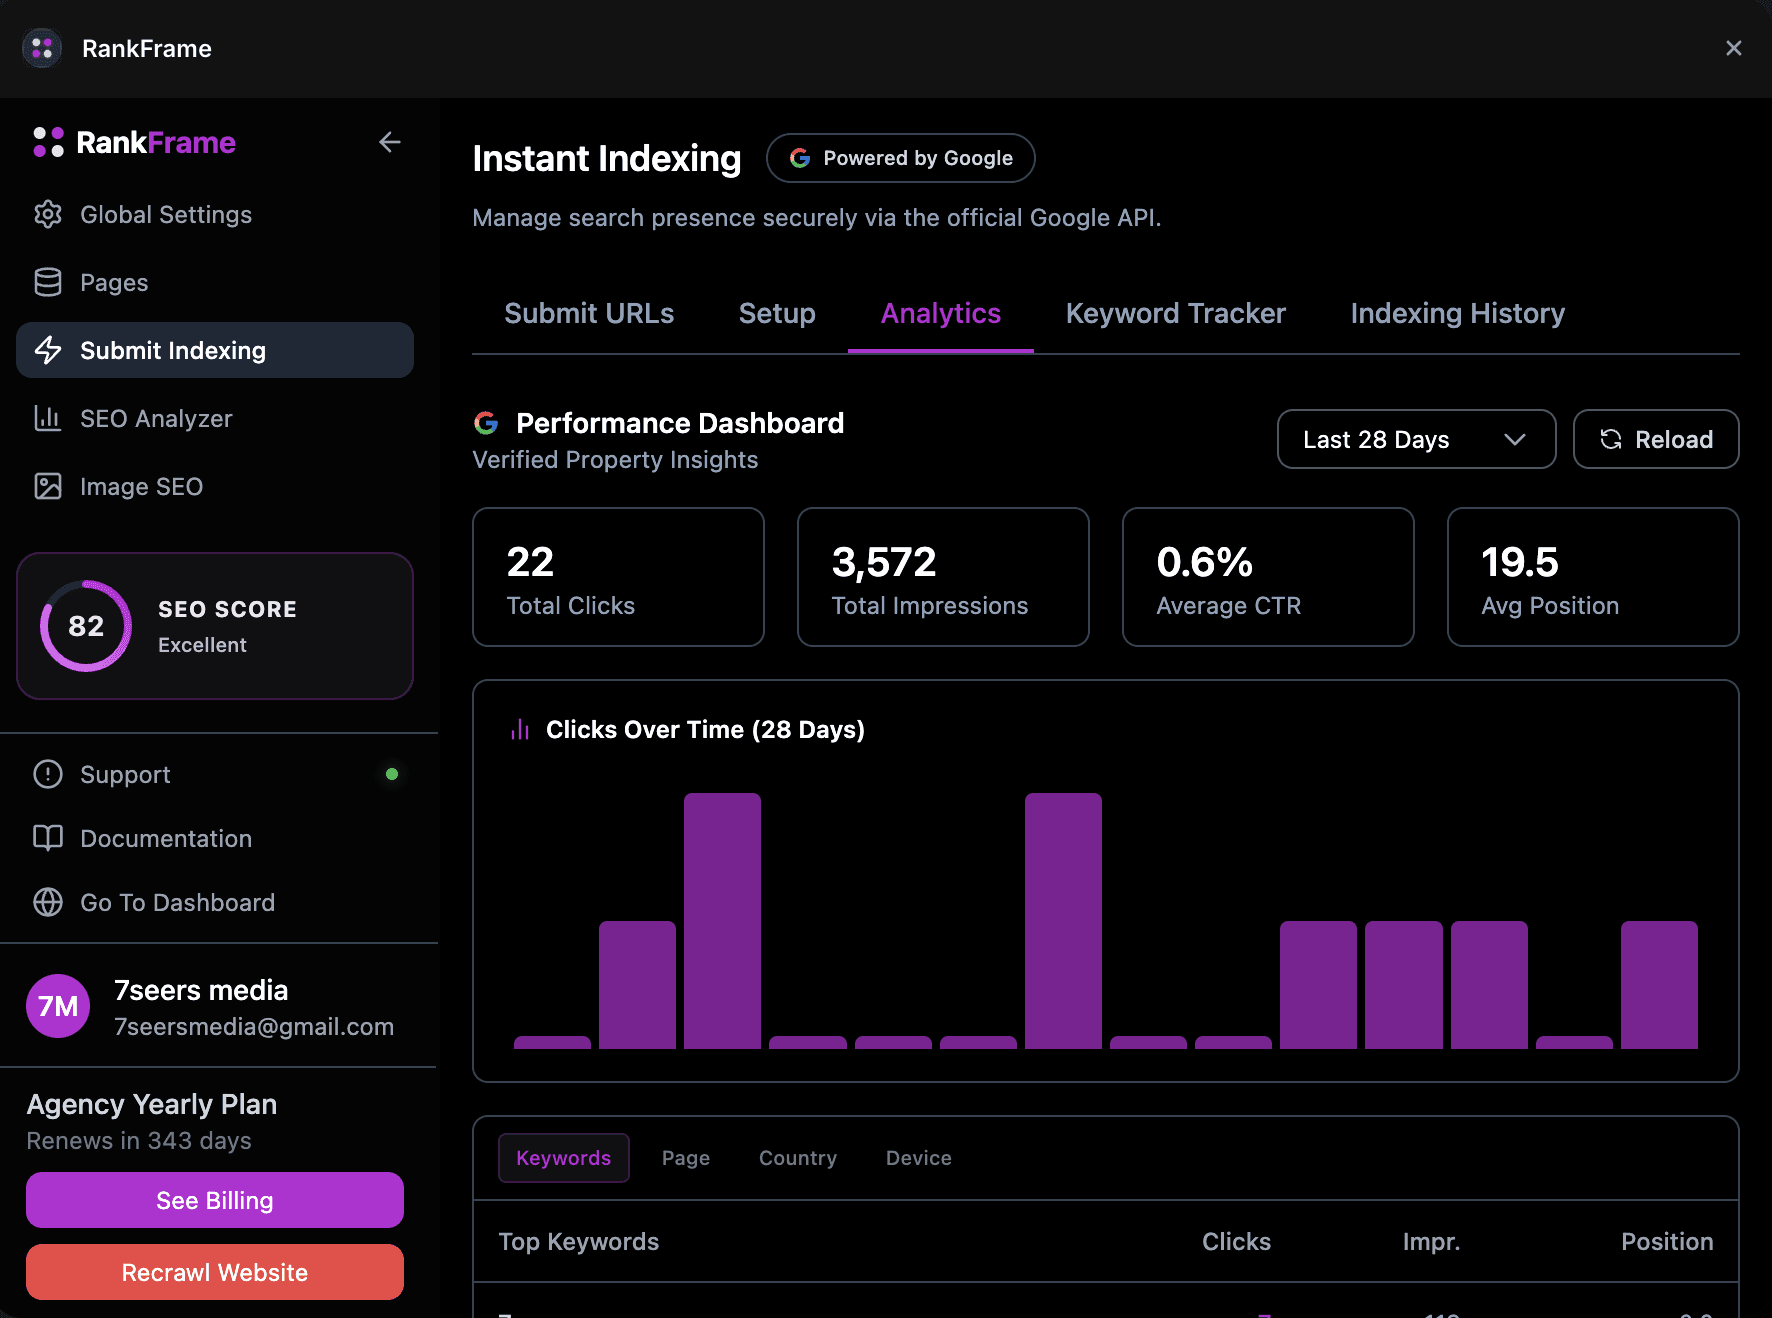
The Performance Dashboard appears in the Analytics section of the Submit Indexing tab. It is labeled with the Google G logo and a Verified Property Insights badge, confirming that the data comes directly from your connected Google Search Console property for your Framer site.
All metrics update in real time when you change the date range or click Reload. No data is stored inside RankFrame itself. Every number you see reflects what Google Search Console currently reports for your verified property.
You must complete the Setup tab (connect your Google account and verify your domain) before the Performance Dashboard shows any data. If the dashboard appears empty, check your connection status in the Setup tab first.
Dashboard fields
1. Date Range and Reload
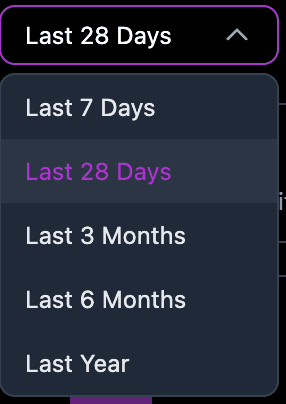
These two controls sit at the top of the Performance Dashboard and determine which time window all metrics and charts reflect.
Click the Date Range dropdown to choose a reporting window. The default is Last 28 Days. All four headline metrics, the bar chart, and the drill-down tables update together when you change this value.
Click Reload to refresh all data from Google Search Console. Data from Search Console typically has a delay of one to two days, so very recent activity may not appear immediately.
Google Search Console data has an inherent delay of 24 to 48 hours. If today's traffic is not showing, that is expected behavior from Google, not a RankFrame issue.
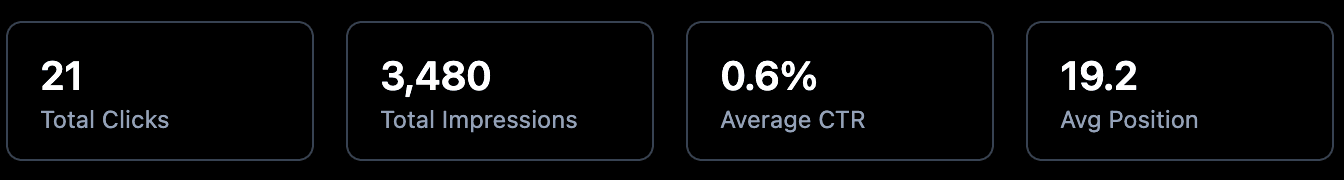
2. Total Clicks
The Total Clicks metric shows how many times users clicked through to your site from Google search results during the selected date range. This is the most direct measure of traffic generated by organic search.
If impressions are high but clicks are low, your pages are appearing in search results but not compelling users to click. Review your page titles and meta descriptions to improve click-through rate.
3. Total Impressions
The Total Impressions metric shows how many times any URL from your site appeared in Google search results during the selected date range, regardless of whether it was clicked. A growing impression count means Google is surfacing your content more often.
4. Average CTR
Average CTR (click-through rate) is the percentage of impressions that resulted in a click. A higher CTR means your titles, descriptions, and rich results are resonating with searchers. Pages at position 1 typically see CTR above 25%, while pages at position 10 often see less than 3%.
To improve CTR without changing your ranking, rewrite your page titles to be more specific and action-oriented, and ensure meta descriptions accurately preview the page content.
5. Avg Position
Avg Position shows the average ranking position of your site's URLs across all search queries. Position 1 is the top result on page one. A lower number is better. Watch this metric over time, a steady decrease signals that your pages are climbing in Google rankings.
Average position is a mean across all queries. Use the Keywords drill-down tab to see per-query positions for a more granular view.
6. Clicks Over Time Chart
The Clicks Over Time bar chart visualizes your daily click volume across the selected date range. Each purple bar represents the number of clicks your site received on that day. Use this chart to spot trends, identify traffic spikes, and detect drops that may correspond to algorithm updates or site changes.
Taller bars indicate days with higher click volume.
A sudden drop may indicate a Google algorithm update, a page going down, or a significant ranking change.
A gradual upward trend over weeks indicates improving organic visibility.
7. Drill-down Tabs
Below the chart, four tabs let you break down your Search Console data by different dimensions:
Keywords: Shows the search queries that drove traffic to your site, with click count, impression count, and average position per keyword.
Page: Groups performance by URL, helping you identify which pages drive the most traffic and which have strong impressions but low CTR.
Country: Shows which countries your search traffic originates from, useful for understanding geographic distribution.
Device: Breaks down performance by device type (desktop, mobile, tablet). Use this to confirm your mobile experience is strong, since Google uses mobile-first indexing.
Sort the Keywords table by impressions to find queries where your pages appear frequently but receive few clicks. These are opportunities to improve your titles and meta descriptions to win more traffic without needing to change your ranking.
Frequently asked questions
Where does the data in the Performance Dashboard come from?
All data is pulled live from Google Search Console using the account you connected in the Setup tab. RankFrame queries the Search Console API directly, so the numbers match what you would see if you opened Search Console in a browser.