
<- Go Back
Keyword Tracker
Reading Position History and Ranking Changes in RankFrame
Learn how to interpret the position history sparklines and ranking change indicators in the RankFrame Keyword Tracker. Understand what movements mean and how to use trend data to guide your Framer SEO decisions.
Last Updated on
Read Time
3 min read
1. The Position History Sparkline
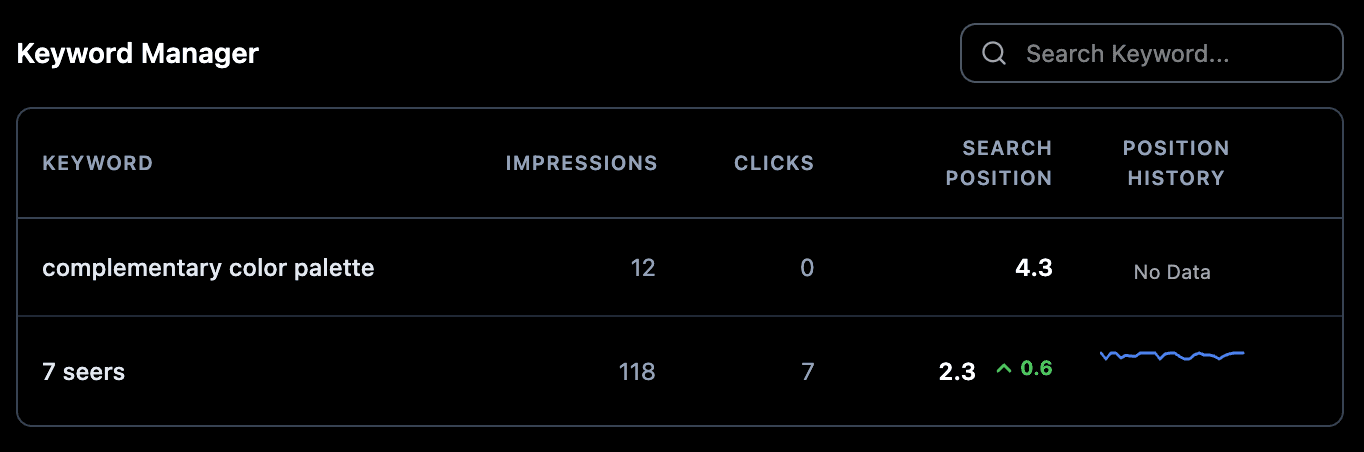
A small line chart appears in the rightmost column of the keyword table. Each data point on the sparkline represents the average Google position for that keyword on your Framer site during a reporting period. The line runs left (oldest data) to right (most recent). A line trending downward (lower position numbers) means better ranking. A line trending upward means the ranking dropped. Think of the sparkline as a quick health signal: no deep analysis required, just a glance tells you the direction.
2. Position Numbers: Lower Is Better
Search position 1 means your page is the top organic result. Position 10 is the last result on the first page. Position 11 and above means page 2 or beyond. When a sparkline trends toward smaller numbers over time, your ranking is improving. When it trends toward larger numbers, your ranking dropped. Keep this inverse relationship in mind: a sparkline line moving visually downward on screen (toward smaller Y-axis values) is good news for your SEO.
3. The Position Change Indicator
When position improves since the previous data point, a green up arrow appears next to the current position number with the numeric delta. For example, "up 0.3" means your average position moved from 2.7 to 2.4. This indicator is absent if position stayed the same or declined. A red or downward indicator (if present) signals a drop. Use this indicator as a quick check during your weekly review: green deltas across multiple keywords confirm your optimization work is moving in the right direction.
4. Impressions and Clicks Columns
These columns show total impressions and clicks from Google Search Console for the period. A keyword with high impressions but low clicks has a low CTR (click-through rate), meaning your page appears in results but does not attract clicks. This is worth improving: check if your meta title and description are compelling for that query. Improving CTR does not require any Google ranking change; it is purely about how your result looks in the SERP compared to competitors.
5. Search Position Column
The current average position displays as a decimal (for example, 2.4). This is the average across all Google searches that triggered an impression for that keyword during the data period. A position of 4.9 means your page typically appears in roughly the 5th spot. Decimals are normal and expected: because position is averaged across many queries and devices, round numbers are rare. Do not read too much into small decimal differences between check-ins.
6. Data Refresh Cadence
Google Search Console data has a built-in lag of 48 to 72 hours. Position history sparklines update as new data arrives. Do not expect daily changes: weekly reviews of position trends are the most useful cadence for SEO decision-making. Checking your Keyword Tracker every day can create a false sense of urgency around normal data delays. Set a recurring weekly review instead, and look at 4-week or 8-week trend windows for the clearest signal.
How to Interpret Common Sparkline Patterns
Three patterns appear frequently once you have a few weeks of data. Recognizing them quickly cuts down the time you spend trying to decide whether to act.
Steady downward trend (positions improving over weeks)
Your SEO work is compounding. A consistent drift toward lower position numbers over 4 to 8 weeks means your content updates, internal links, and schema are having the intended effect. Keep publishing and optimizing. Resist the urge to make dramatic changes when something is already working.
Flat line with no change
The keyword is stable. Google has settled on a consistent position for your page relative to competitors. Consider whether to invest more content effort on this term or accept the current position. A flat line around position 8 to 12 is a candidate for a focused content refresh: strengthening the page could push it into the top 5. A flat line at position 2 to 3 is a sign to maintain, not over-optimize.
Sharp upward spike then recovery
A sudden jump in position number (for example, moving from 5 to 18 in one data period) often coincides with a Google core update temporarily shifting rankings. If position returned to baseline within 2 to 4 weeks, no action is needed. If it did not recover, revisit on-page optimization: check heading structure, content depth, E-E-A-T signals, and whether any competitor significantly updated their page during that window.
Frequently asked questions
My sparkline shows no data. Why?
Newly added keywords need 48 to 72 hours for Search Console data to appear. Keywords for which your site has no impressions yet (for example, you have never ranked for that term) will show no history until Google starts returning your pages for that query. If you recently published the page, wait a few days and check again after Google has had time to crawl and index it.