
<- Go Back
404 Monitor
Reading the 404 Errors Table
Understand every column in the RankFrame 404 Monitor errors table, including Page URI, User Agent, Last Hit, and Hits. Learn how to filter, reload, and export your 404 data.
Last Updated on
Read Time
4 min read
Overview

Once the 404 Monitor script is active on your published site, every broken URL that visitors or bots encounter is logged and displayed in the errors table. The table updates in real time as new hits come in and gives you the raw data you need to identify, prioritize, and fix broken links.
Above the table, a controls row lets you filter, refresh, and export data. The table itself has four columns: Page URI, User Agent, Last Hit, and Hits. Rows are paginated so large data sets stay manageable.
Page URI | User Agent | Last Hit | Hits |
|---|---|---|---|
/old-page | Chrome 124 / macOS | May 1, 2026 14:32 | 47 |
/projects/old-name | Googlebot | May 2, 2026 08:11 | 12 |
/blog/removed-post | Safari / iOS 17 | Apr 28, 2026 19:04 |
1. All Domains filter
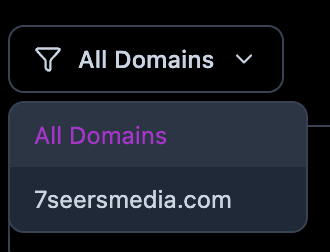
The All Domains dropdown at the left of the controls row lets you narrow the table to a single domain. By default, errors from every domain in your Allowed Domains list are shown together. Select a specific domain from the dropdown to see only the errors logged for that site.
This filter is especially useful if you manage multiple Framer projects or staging domains and want to focus on one at a time without noise from the others.
2. Reload button
Click the Reload button to fetch the latest error data from RankFrame's servers without leaving the plugin. The table updates immediately after you click it.
Use Reload after you have fixed a broken route and republished your site to confirm that new hits on that path have stopped coming in. It is also useful after adding a new domain to confirm errors are being captured.
3. Export button (CSV download)
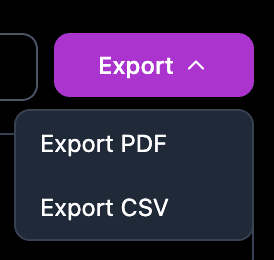
Clicking Export downloads a CSV file containing all 404 error data currently in the table. The export respects the active domain filter, so if you have selected a specific domain, only that domain's errors are included in the file.
Common uses for the CSV export:
Sharing a broken link report with a client or team member
Importing the data into a spreadsheet to track fix progress
Cross-referencing 404 routes against your redirect rules in Framer
4. Page URI column
The Page URI column shows the exact URL path that returned a 404, for example /old-page or /projects/old-name. This is the path relative to the domain root, not the full URL.
For long paths that would be hard to copy by hand, a copy icon appears next to the URI. Click it to copy the full path to your clipboard instantly so you can paste it into Framer's redirect settings or your issue tracker without risk of typos.
Use the Page URI directly as the "from" path when creating a redirect in Framer. Copy it with the icon to avoid introducing new typos.
5. User Agent column
The User Agent column identifies the browser or bot that triggered the 404 hit. Examples include a specific browser and OS combination like Chrome 124 / macOS, or a crawler identifier like Googlebot.
User Agent data helps you understand who is hitting a broken link:
If the User Agent is a search engine crawler such as Googlebot, that route is being indexed or was previously indexed, and fixing it is a priority for SEO.
If the User Agent is a real browser, a visitor encountered the broken link directly, which affects user experience and bounce rate.
If you see monitoring or uptime bots, the hit may not reflect real user traffic and can be deprioritized or added to Exception Routes.
6. Last Hit column
The Last Hit column shows the timestamp of the most recent time a request to that route returned a 404. Timestamps are displayed in your local time zone.
A recent Last Hit date means the broken route is still being accessed. A very old Last Hit date (weeks or months ago with no new traffic) may indicate a route that is no longer being linked to and is lower priority.
Last Hit updates every time that specific route is hit again. If you add a redirect and the date stops advancing, your fix is working.
7. Hits column
The Hits column shows the total number of times that specific route has returned a 404 since monitoring began. This is a cumulative count and resets only if you manually clear the data.
A high Hits number indicates a route that was heavily linked, bookmarked, or indexed before it broke. These routes have the most impact on SEO and user experience and should be addressed first.
Prioritizing which broken links to fix first
Use Last Hit and Hits together to triage your broken link backlog:
High Hits + recent Last Hit: Fix immediately. This route is actively broken and being accessed regularly.
High Hits + old Last Hit: Important but less urgent. The link was popular but traffic may have tapered off.
Low Hits + recent Last Hit: Monitor. Could be a newly broken link that has not had time to accumulate hits yet.
Low Hits + old Last Hit: Lowest priority. Likely a legacy path that is no longer actively linked.
Also check the User Agent column. Routes hit by Googlebot with a high Hit count are the most SEO-damaging and should jump to the top of your fix list.
Frequently asked questions
Does the table update automatically as new errors come in?
The table loads the latest data each time you open the 404 Monitor tab. Click Reload at any time to pull fresh data without closing and reopening the plugin.