
<- Go Back
Page Speed
Mobile vs Desktop Performance Scores in RankFrame
Learn how RankFrame measures mobile and desktop performance separately, what each gauge means, and why mobile speed matters most for ranking your Framer site on Google.
Last Updated on
Read Time
3 min read
1. Mobile Performance Gauge
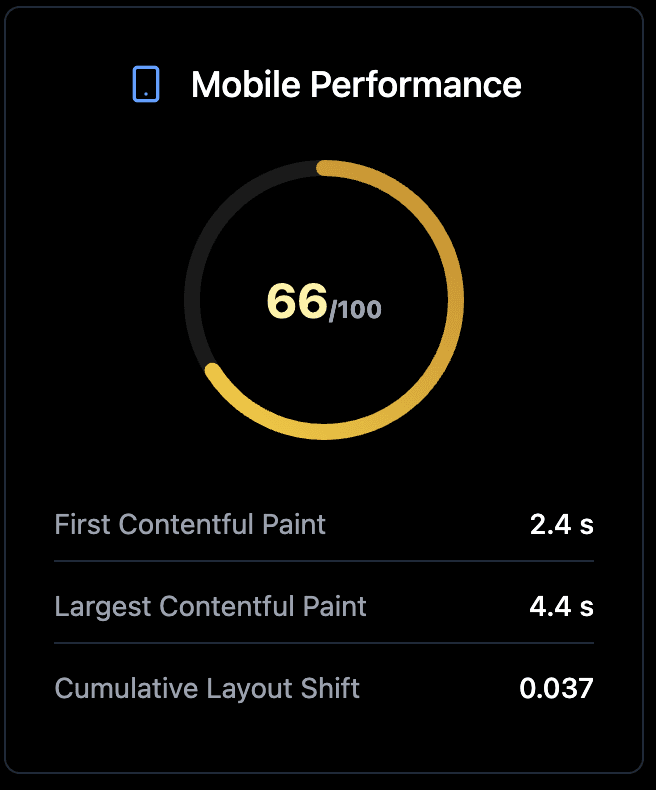

Scored from 0 to 100. Color coding: green (90+), amber (50 to 89), red (below 50). Mobile audits simulate a mid-tier Android device on a slow 4G connection. This is intentionally harsh because real-world mobile users span a huge range of devices and networks. Mobile is the score Google uses for ranking under mobile-first indexing.
2. Desktop Performance Gauge
Scored from 0 to 100, same color thresholds. Desktop audits simulate a fast cable connection and a powerful CPU. Desktop scores are typically 20 to 40 points higher than mobile for the same page. Desktop matters for user experience but mobile is what affects ranking.
3. Why Mobile Scores Are Always Lower
Three reasons: (1) Mobile networks are slower (Lighthouse simulates 1.6 Mbps download), (2) Mobile CPUs are weaker (Lighthouse simulates 4x CPU slowdown), (3) Mobile viewports require different rendering paths. A page that scores 95 on desktop can easily score 65 on mobile without any actual problem with the page.
4. Mobile-First Indexing
Since 2021 Google indexes the mobile version of your page first. The mobile version is what Google ranks. If your mobile Performance score is poor, your page rank suffers even if desktop is perfect. Always optimize for the mobile gauge first.
5. Realistic Targets for Framer Sites
Image-heavy Framer sites: aim for mobile 60 to 75, desktop 85+. Marketing landing pages with minimal media: aim for mobile 80+, desktop 95+. SaaS dashboards (less media, more JavaScript): aim for mobile 70+, desktop 90+. Hitting 100 on either gauge is rarely achievable on a Framer site without sacrificing visual richness.
6. Re-analyze Speed Button
The Re-analyze Speed button in the Speed tab triggers a fresh Lighthouse audit for both mobile and desktop. Allow 30 to 60 seconds for both audits to complete. The gauges and Core Web Vitals refresh together. Re-run after any major change (image swap, component removal, font change) to verify the impact.
If Your Mobile Score Is Below 50
Focus on these three levers in order. Each one tends to deliver the largest gain for the least effort on a Framer site.
Image optimization: the biggest single lever. Convert to WebP, compress, set dimensions.
Unused JavaScript: remove custom code components and embeds you no longer use.
Font loading: use Framer's built-in font system instead of synchronous external fonts.
Frequently asked questions
My desktop score is 95 but mobile is 55. Is that a problem?
Yes. Google ranks based on mobile under mobile-first indexing. A mobile score of 55 is in the "Poor" range and will hurt rankings. Focus optimization on mobile.
Related to